Advanced Bodyshop Assessment
Receive a Complete Operational Assessment Tailored To Your Needs
We provide a diagnostic framework designed to identify inefficiencies, improve performance, and transform collision centers into lean, high-performing operations. Every assessment concludes with a strategic roadmap outlining quick wins, long-term initiatives, and measurable targets tailored to your bodyshop’s needs.
Our Framework Includes
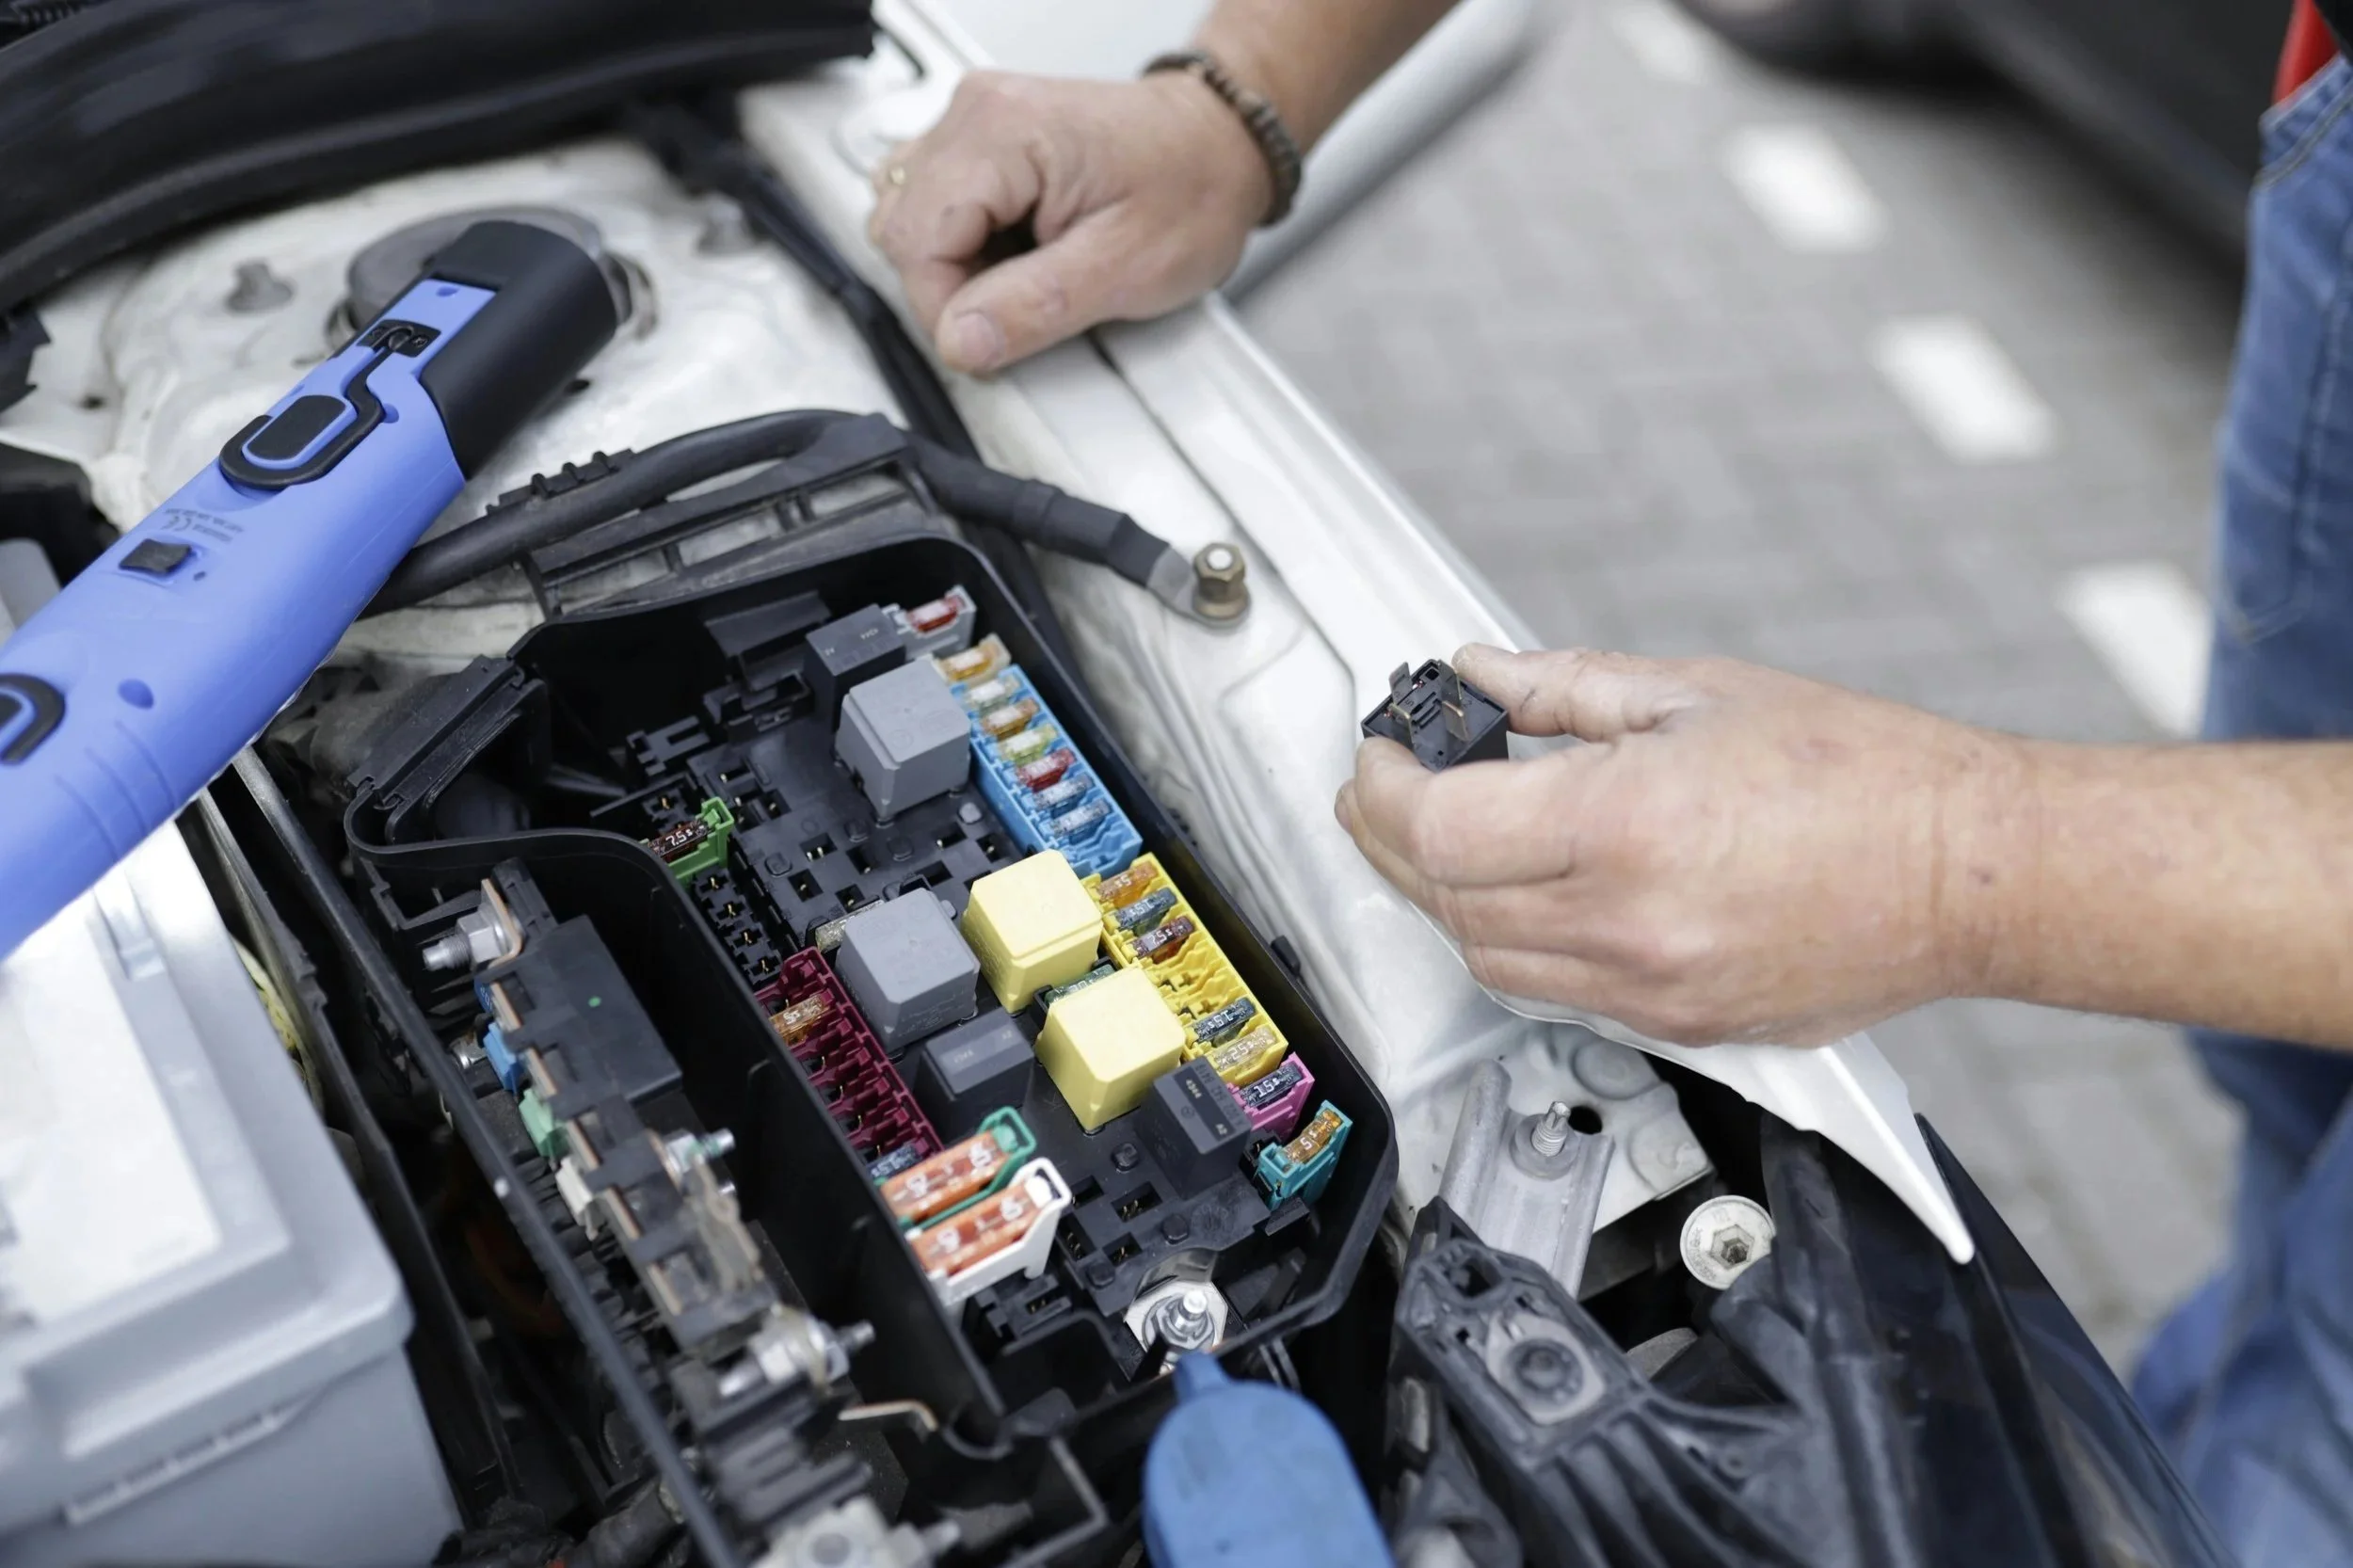
Departmental Analysis
A full review of front office, estimating, production, paint, detail, and parts operations to uncover workflow gaps and process inefficiencies.
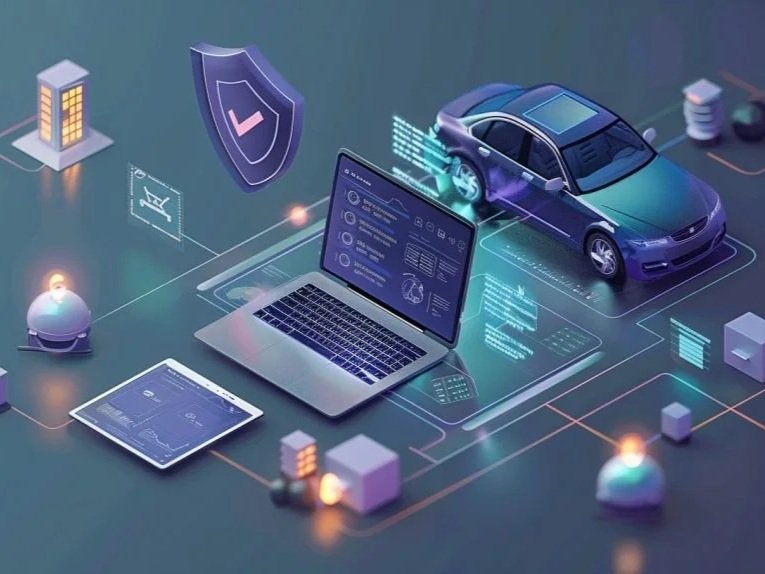
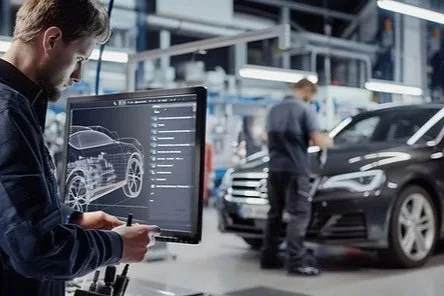
Tech & Data Systems Review
Evaluate software integration, KPI tracking, and reporting accuracy to improve decision-making and real-time performance monitoring.

Staffing & Structure Optimization
Assess labor allocation, accountability, and role clarity to build a more efficient and motivated team.

Facility Layout & Flow
Examine shop layout, safety, and material movement to increase throughput without facility expansion.

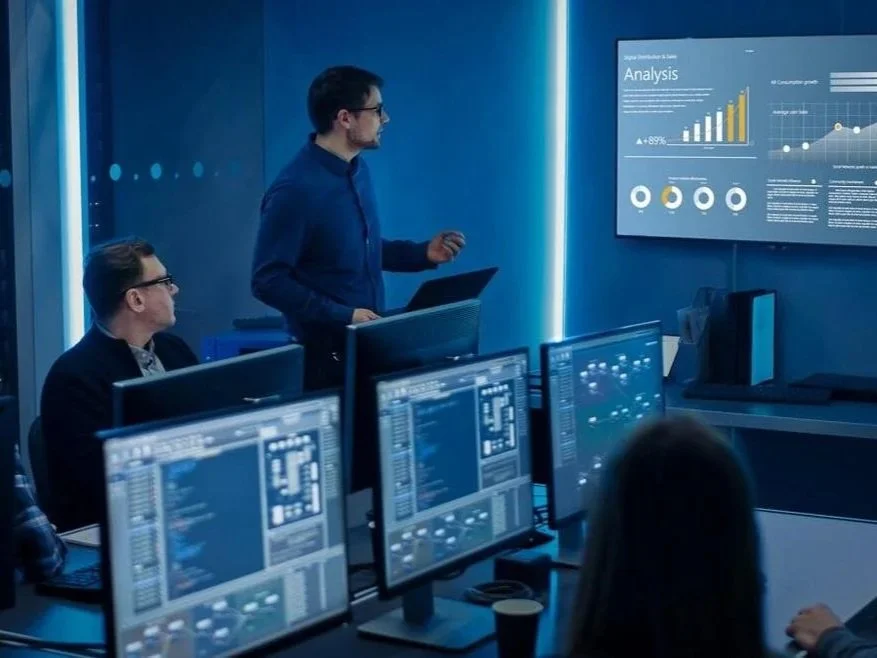
KPI Benchmarking
Compare current performance metrics against industry benchmarks to identify realistic improvement goals.
Results You Can Expect
Increased vehicle throughput and reduced cycle time
Improved technician efficiency, morale, and accountability
Greater insurer confidence and stronger DRP relationships
Data-driven decision making through continuous performance tracking
Scalable SOPs for sustainable growth and multi-location consistency
Read our complete Body Shop Assessment Framework below to see how each stage delivers results.
-
Client Profile: Location, shop size, DRP affiliations, OEM certifications, key management contacts.
Objective Alignment: Define short and long-term goals (e.g., increased throughput, margin growth, DRP acquisition, staff training).
Confidentiality Agreement: Mutual confidentiality agreement is established.
-
A. Reception / Front Office
Scheduling Process:
How are bookings managed?
Is there backlog or customer dissatisfaction?
Customer Updates:
Are updates proactive, structured, and consistent?
Adjuster Interaction:
Communication flow with insurers – efficient or disruptive?
Use of Information:
How well is customer and vehicle data gathered, stored, and transferred into production?
B. Estimating Department
Estimator Coverage & Flow:
Ratio of estimators to vehicles.
Accuracy & Supplement Management:
How many supplements are being written? Are initial estimates comprehensive?
KPI Tracking:
Close ratio, approval time, supplement cycle.
Insurer Compliance:
How well do estimates meet DRP or insurer expectations?
C. Production Department
Body:
Skill Distribution & Labor Efficiency:
Are technician levels aligned with job complexity?
Work Flow & Staging:
Is the floor optimized for flow or congested/disjointed?
Cycle Time Bottlenecks:
Where are delays occurring?
Accountability & Job Ownership:
Is work tracked by tech or team?
Paint:
Paint Booth Scheduling:
Are booths under- or over-utilized?
Color Matching & Prep Standards
QC and Reworks:
What’s the rework rate? Are defects logged?
Detail / Quality Control:
Final Inspection Process
Delivery Preparation Timeline
Customer Satisfaction Readiness
D. Parts Department
Ordering Process:
Timing, accuracy, returns.
Receiving & Labeling System
Storage Efficiency
Communication with Production
Are delays in parts affecting vehicle progress?
E. Supplement & Admin Flow
Admin Workload
Supplement Turnaround Times
Follow-ups & Insurer Communication Efficiency
-
Shop Management System (SMS):
Usage level, integration, reporting accuracy.
Digital Tools:
Photo capture, estimating, parts portals.
Data Capture for KPI Monitoring:
What’s being tracked? What’s missing?
-
Roles & Responsibilities Clarity: Evaluate how well-defined each role is across departments to ensure accountability, ownership, and alignment with production goals.
Labor Allocation by Department: Analyze staffing distribution to confirm the right mix of technicians, estimators, and support personnel for optimal efficiency and throughput.
Training Gaps: Identify skill gaps and recommend targeted training programs to enhance performance, consistency, and safety standards.
Attendance and Productivity Challenges: Review attendance trends, workload balance, and individual productivity metrics to uncover underlying causes of downtime or delays.
-
Space Optimization:
Assess the overall flow of vehicles, technicians, and parts throughout the facility to ensure smooth movement, minimize bottlenecks, and maximize workspace efficiency.
Safety & Cleanliness
Evaluate the shop’s safety practices and organization standards to maintain compliance and support a productive working environment.
Customer Area Experience
Review the design and condition of customer-facing areas to ensure a professional, welcoming atmosphere that reflects the quality and standards of the operation.
-
Throughput / Cycle Time: Measure total vehicle output and average repair duration to evaluate operational speed and identify opportunities to improve efficiency.
Gross Profit Margins (Labor & Parts): Analyze profitability across key revenue streams to ensure accurate costing, pricing alignment, and margin optimization.
Touch Time: Assess daily technician productivity to track how effectively labor hours translate into completed work.
Capture Rate: Review how consistently the shop secures available repair opportunities from estimates and DRP referrals.
Rework Rate: Evaluate the frequency and causes of rework to improve quality control, reduce waste, and enhance customer confidence.
Customer Satisfaction Scores (CSI): Compare customer experience scores and feedback against industry benchmarks to monitor service quality and retention.
-
Create a visual map of:
Pain Points: Identify recurring inefficiencies, communication gaps, and production delays that limit throughput and profitability.
Workflow Disruptions: Visualize where operational handoffs break down across departments to isolate the root causes of downtime/rework.
Quick Wins vs. Long-Term Strategies: Differentiate between immediate process improvements and larger strategic initiatives, ensuring progress starts now while laying the foundation for sustainable performance gains in the future.
Aim to highlight areas of improvement and prioritize actions based on impact and feasibility.
-
Recommendations are prioritized by impact, feasibility, and timeline to ensure measurable progress and accountability.
Process Improvements: Implement refined workflows and standardized procedures to reduce waste, increase consistency, and strengthen inter-departmental communication.
Technology Integration: Leverage management systems, digital tools, and AI-driven analytics to enhance real-time decision-making.
Staff Realignment / Training: Optimize team structure and responsibilities while providing targeted training to elevate technical skills, morale, and leadership capability.
Revenue-Boosting Tactics: Identify immediate and long-term opportunities for margin improvement through enhanced estimating accuracy, repair mix optimization, and insurer collaboration.
Scalable SOP Implementation: Develop and document operating procedures that can be replicated across multiple locations or scaled for future growth.
Quarterly Progress Targets: Establish measurable milestones, reviewing intervals to monitor improvement, track ROI, and sustain operational discipline over time.
-
The assessment establishes a long-term partnership focused on continuous improvement, measurable growth, and sustained operational excellence.
Phased Improvement Plan: Develop a clear roadmap outlining short-, medium-, and long-term initiatives, allowing your team to implement change progressively while maintaining productivity.
Team Training Modules: Provide tailored training sessions and leadership development programs to reinforce best practices and ensure process adoption.
Monthly or Quarterly Audits: Conduct recurring performance reviews to validate progress, identify new challenges, and keep improvements on track.
ROI Tracking for Implemented Changes: Describe important details like price, value, length of service, and why it’s unique. Or use these sections to showcase different key values of your products or services.
-
CollisionIQ’s ongoing optimization support delivers consistent oversight, accountability, and expertise — ensuring your operation continues to evolve, adapt, and lead in an ever-changing collision industry.

Expected Results Example
| Metric | Current Average | Target Goal | Expected Uplift |
|---|---|---|---|
| Technician Efficiency | 85–100% | 150–200% | +65–100% |
| Touch Time | 2.5 hrs/day | 4.0–4.5 hrs/day | +60–80% |
| Cycle Time | 12–14 days | 8–10 days | +25–35% |
| Gross Profit (Labor) | 42–48% | 55–65% | +10–25% |
| Rework Rate | 5–7% | < 2% | ↓60%+ |
| Supplement Frequency | 45–55% | < 35% | ↓20% |
Related Services

CollisionIQ Consulting Services
Artificial Intelligence Integration

Advanced+ Service: Ongoing Optimizations